Finding the vanishing point in images
Simple method to find vanishing points in images with Canny, Hough
Find vanishing point in image (1 point perspective)
%matplotlib inline
import cv2
import numpy as np
import urllib
import matplotlib.pyplot as plt
Get sample image
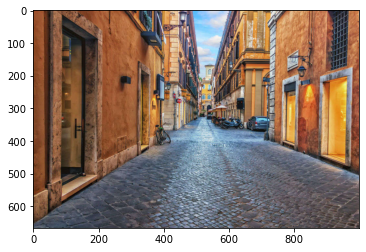
First download a sample image.
def get_image_from_url(url):
    """https://stackoverflow.com/a/3969809"""

    with urllib.request.urlopen(url) as u:
        s = u.read()
    arr = np.asarray(bytearray(s), dtype=np.uint8)
    img = cv2.imdecode(arr, -1) # 'Load it as it is'
    img = cv2.cvtColor(img, cv2.COLOR_RGB2BGR)

    return img

img = get_image_from_url('https://static.toiimg.com/photo/69928969/cobble.jpg')
plt.imshow(img)
<matplotlib.image.AxesImage at 0x7fb5ef127670>
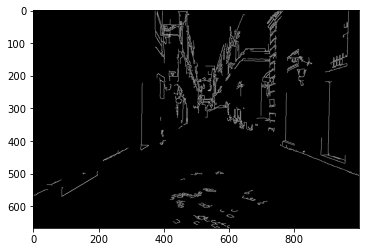
Edge detection
We are interested in using the most prominent edges in the image to compute the Hough lines. To find the edges, we use Canny edge detection.
gray = cv2.cvtColor(img, cv2.COLOR_RGB2GRAY)
edges = cv2.Canny(gray, 200, 700)

plt.imshow(edges, cmap='gray')
<matplotlib.image.AxesImage at 0x7fb5ef468e80>
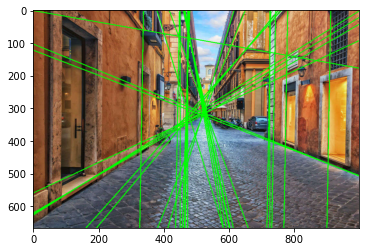
Hough lines from edges
We can use the edges obtained above to compute Hough lines.
lines = cv2.HoughLines(edges, 1, np.pi/180, 100)
img_lines = img.copy()

# adapted from https://stackoverflow.com/a/60515853
for line in lines:
    rho,theta = line[0]
    a = np.cos(theta)
    b = np.sin(theta)
    x0 = a*rho
    y0 = b*rho
    x1 = int(x0 + 10000*(-b))
    y1 = int(y0 + 10000*(a))
    x2 = int(x0 - 10000*(-b))
    y2 = int(y0 - 10000*(a))
    cv2.line(img_lines, (x1,y1),(x2,y2),(0,255,0),2)

plt.imshow(img_lines)
<matplotlib.image.AxesImage at 0x7fb5da4183a0>
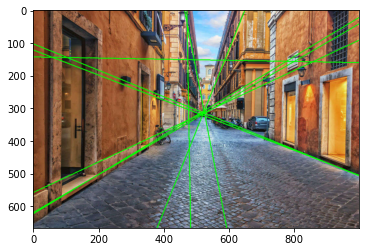
lines = cv2.HoughLines(edges,
                       0.85,
                       np.pi/180,
                       100,
                       # min_theta=np.pi/36,
                       # max_theta=np.pi-np.pi/36
                      )

img_lines = img.copy()

segments = []
for line in lines:
    rho, theta = line[0]
    # skip near-vertical lines
    if abs(theta-np.pi/90) < np.pi/9:
        continue

    a = np.cos(theta)
    b = np.sin(theta)
    x0 = a*rho
    y0 = b*rho

    x1 = int(x0 + 10000*(-b))
    y1 = int(y0 + 10000*(a))

    x2 = int(x0 - 10000*(-b))
    y2 = int(y0 - 10000*(a))

    segments.append((np.array((x1, y1)),
                     np.array((x2, y2))))

    cv2.line(img_lines, (x1,y1),(x2,y2),(0,255,0),2)

plt.imshow(img_lines)
<matplotlib.image.AxesImage at 0x7fb5786558b0>
def seg_intersect(s1, s2):
    """https://stackoverflow.com/a/3252222"""
    da = s1[0] - s1[1]
    db = s2[0] - s2[1]
    dp = s1[0] - s2[0]
    dap = perp(da)
    denom = np.dot( dap, db)
    num = np.dot( dap, dp )
    return (num / denom.astype(float))*db + s2[0]

def perp(a):
    b = np.empty_like(a)
    b[0] = -a[1]
    b[1] = a[0]
    return b

intersections = np.empty((len(segments), len(segments), 2))
intersections[:] = np.nan
for i, s1 in enumerate(segments):
    for j, s2 in enumerate(segments[i:], start=i):
        if i != j:
            intersections[i,j] = seg_intersect(s1, s2)

intersections = intersections[~np.isnan(intersections)]
intersections = intersections.reshape((int(len(intersections)/2), 2)).astype(np.int16)
intersections
array([[484, 332],
       [522, 314],
       [858, 157],
       [550, 301],
       [513, 318],
       [523, 314],
       [525, 313],
       [477, 335],
       [525, 307],
       [776, 156],
       [170, 520],
       [509, 317],
       [517, 312],
       [524, 308],
       [477, 336],
       [587, 153],
       [520, 318],
       [519, 321],
       [522, 314],
       [524, 309],
       [479, 422],
       [800, 156],
       [ 58, 144],
       [103, 144],
       [493, 151],
       [474, 151],
       [517, 320],
       [526, 315],
       [525, 315],
       [477, 343],
       [926, 477],
       [527, 323],
       [476, 304],
       [525, 315],
       [476, 295],
       [472,  40]], dtype=int16)
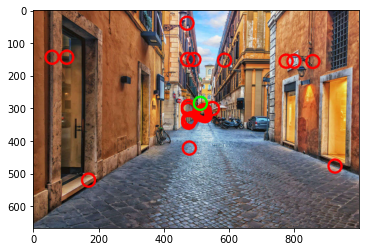
img_points = img.copy()

# show all intersection points
for p in intersections:
    cv2.circle(img_points, (p[0], p[1]), 20, (255,0,0), 5)

# show mean intersection point
vp_hat = np.mean(intersections, axis=0).astype(np.int16)
cv2.circle(img_points, (vp_hat[0], vp_hat[1]), 20, (0,255,0), 5)

plt.imshow(img_points)

print(f"Estimated vanishing point coordinates:", vp_hat)
Estimated vanishing point coordinates: [513 285]